|
Select an indicator
| Agricultural trade - All agricultural products |
The Dutch agricultural sector in an international context, version 2022
|
04/03/2024
|
The value of agricultural exports in 2021 is estimated at 104.7 billion euros, a record. Wageningen University & Research (WUR) and Statistics Netherlands (CBS) report this on the basis of joint research commissioned by the Ministry of Agriculture, Nature and Food Quality (LNV).
Agricultural exports in 2021 will be 9 billion euros (9.4 percent) higher than in 2020. The growth of agricultural exports is due to both an increase in prices and a growth in export volume. The price increase is slightly greater than the volume growth.
Download the full publication here.
This article on Agrimatie.nl contains a selection from the publication to be downloaded above; "The Dutch agricultural sector in an international context, edition 2021". The different chapters and four specific trade groups are shown separately and can be clicked on via the box on the right side of this screen. All these chapters, sections or product groups are also from this edition. For a correct interpretation of the figures, reading the downloadable version of the report is preferred. For the literature references you can also consult the downloadable report.
In this article you can read the introduction and the summary.
|
Introduction
Each year, the Minister of Agriculture, Nature and Food Quality (LNV) looks back on the international trade performance of the Dutch agricultural sector in the previous year. Traditionally, this takes place in January during the Grüne Woche, the largest agricultural consumer fair in Europe and beyond. In the run-up to the Grüne Woche, Wageningen Economic Research and Statistics Netherlands are making an estimate of international performance for the Ministry of Agriculture, Nature and Food Quality. That also happened this year, although the Grüne Woche will not take place in 2022 due to the corona pandemic.
In addition to insight into the export and import figures, for both agricultural goods and agricultural-related goods, this year&39;s publication contains six sections in which a trade topic is highlighted. For this edition, the topics are the consequences of Brexit a year later, the consequences of the outbreak of the corona pandemic, trade policy and tariffs, the destination of the import of agricultural goods, trade in organic agricultural goods and trade and prosperity in an international perspective.
This publication is the result of the work of many authors. The draft publication has been read and commented on by various people inside and outside the organizations involved. We thank everyone for their efforts.
On behalf of;
prof.dr.ir. J.G.A.J. (Jack) van der Vorst
Algemeen Directeur Social Sciences Group (SSG)
Wageningen University & Research
Ir. O. (Olaf) Hietbrink
Business Unit Manager Wageningen Economic Research
Wageningen University & Research
Drs. A (Angelique) Berg
Directeur-Generaal van het Centraal Bureau voor de Statistiek
Summary
Key Points in the Trade of Agricultural Goods
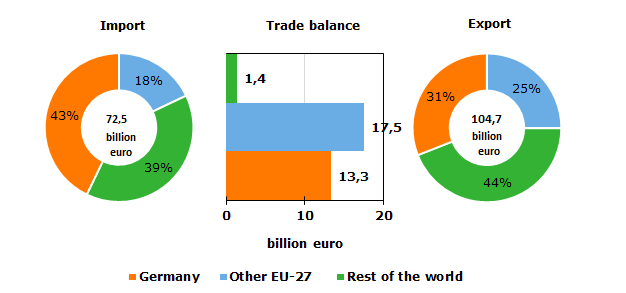
• We estimated Dutch exports of agricultural goods (primary unprocessed goods and secondary processed goods) at €104.7 billion for 2021, which is 9.4% higher than in 2020 (€95.7 billion). This is a new record. See Figure S.1
• Agricultural goods account for just over half of the total trade surplus in goods of the Netherlands. See Section 2.2
• The estimated total exports (€104.7 billion) of agricultural goods in 2021 consisted of €75.7 billion of exported goods of Dutch origin and €29.0 billion of re-exported agricultural goods originating from other countries. That is a growth of 10.7% in Dutch-manufactured exports compared to 2020 and a growth of 6.1% in re-exports. See Section 2.2
• Of total agricultural exports, 27.7% were re-exports of foreign origin, while 72.3% were of Dutch origin. In comparison, 52.5% of exports of non-agricultural products in 2021 were of Dutch origin. See Section 2.3
• The new export record is due to both increased prices and growth in export volume: prices of exports increased slightly more than volume, but more than two-thirds of the value growth in imports was from increased prices. See Section 2.4
• Imports of agricultural goods also reached a new record. The import value for 2021 is estimated at €72.5 billion, a growth of 9.9% compared to 2020 (€65.9 billion). Between 2008 and 2021, agricultural imports increased in value by 74% and agricultural exports increased by 61%. See Section 2.2
• The trade surplus of the Netherlands with countries in the EU 27 was €30.8 billion, of which €13.3 billion was with Germany. The trade surplus with non-EU countries (including the UK) was €1.4 billion (Figure S.1).
• As in previous years, in 2021 most agricultural exports went to our neighbouring countries. A quarter of the estimated total exports went to Germany (€26.3 billion). Belgium was in second place with 12% (€12.1 billion). This was followed by France and the UK (both 8% or €8.6 billion) as most important buyers. These four neighbouring countries accounted for 53% of total Dutch agricultural exports. See Section 3.2
• The EU – excluding the UK – is by far the largest export market for the Netherlands, with a share of 69% in 2021. This is slightly more than in 2020 (67%). This growth was due to the greater increase in export value to EU countries than to countries outside the EU. The same development can be seen in agricultural imports – the EU share rose from almost 56% to more than 57%. See Sections 3.2 and 3.4
• The main commodity groups in agricultural exports were ornamental horticultural products (€12.0 billion), meat (€9.1 billion), dairy products and eggs (€8.7 billion), vegetables (€7.2 billion) and fruit (€7.0 billion). These five commodity groups accounted for 42% of the total export value in 2021.
• Regarding imports, natural fats and oils (€7.14 billion) become the most important commodity group in 2021, taking first position from fruit (€7.07 billion). This was followed by the commodity groups drinks (€5.0 billion), oilseeds and oleaginous fruit (€4.9 billion) and dairy products/eggs (€4.3 billion). Together, these five product groups accounted for 39% of the total import value of agricultural goods.
• See Chapter 4 for the developments per product.
• With regard to agricultural goods, the Netherlands earns the most from the export of ornamental horticultural products, such as flowers, plants, flower bulbs and tree nursery products: €6.0 billion. The figure pertains to the export value minus the value of imports of goods and services that are required to export and produce the goods. There is a substantial gap between ornamental horticultural products and the next-largest categories: meat (€4.6 billion), dairy products and eggs (€4.3 billion), and vegetables (€3.9 billion). On average, agricultural exports yield 43 cents per euro of export value; if re-exports are not included, this is 60 cents. See Section 4.2
S.2.Key aspects of trade in agriculture-related goods
• The export value of agriculture-related goods (tertiary agricultural goods, such as agricultural machinery and fertilisers) from the Netherlands was twice as large as the import value. In 2021 the export value of agriculture-related goods rose to a new record of €10.6 billion (+10%). Imports of agriculture-related goods are also projected to reach a new record (€5.3 billion), 14% more than in 2020. See Section 5.2
• Germany, Belgium and France are top three destinations for agriculture-related exports. In 2021 tertiary exports to the UK decreased by 21%. See Section 5.3
• Exports of agricultural machinery (25%), fertilisers (21%), machinery for the feed and food industry (18%) and greenhouse materials (15%) together accounted for 80% of the total export value. In absolute terms, the greatest growth has occurred in the export of fertilisers (an increase of €0.4 billion). See Section 5.4
• In 2021, the sum of the estimated exports of agricultural goods and agricultural-related goods (known as &39;broad&39; agricultural exports) amounted to €115.3 billion. That is substantially higher than the €105.3 billion of such exports in 2020. See Section 5.2
• The Netherlands earns slightly more on average per euro of export value of agriculture-related goods of Dutch origin than it does per euro of export value of Dutch agricultural goods: 62 cents compared to 60 cents. The net yield of total exports, including re-exports, is also slightly higher (46 cents against 43 cents). See Section 5.5
• Machines for the feed and food industry are the most lucrative per euro of total exports. Without re-exports, greenhouse materials yield the most per euro of export value. See Section 5.5
Sections
Dutch trade with the United Kingdom 2015-2021
Between 2015 and 2021, agricultural trade with the UK clearly underperformed compared to total agricultural trade. This applies to imports, re-exports and exports of Dutch manufacture. For imports and re-exports, the contraction in trade took place entirely in 2021. Dutch-produced agricultural exports to the UK actually grew in 2021 compared to 2020, even slightly more than total Dutch-produced agricultural exports. The difference in developments in 2021 is firstly because the EU was already enforcing specific phytosanitary and veterinary checks and administrative obligations (EU imports from the UK), but British customs will only begin their enforcement in 2022 (EU exports to the UK). The total effect of Brexit on Dutch agricultural exports will therefore not become clear until 2022. Secondly, from 1 January 2021, import tariffs have applied to products that cannot be proven to have been produced in the EU or the UK. This affects a substantial proportion of re-exports and probably some of the imports (British re-exports) as well. Finally, a significant proportion of the growth in Dutch-manufactured agricultural exports to the UK (measured in value) is attributable to strongly increased ornamental horticulture exports (due to much higher prices). See also Chapter 6
Dutch trade in agricultural goods and two years of the Covid-19 pandemic
Trade in agricultural goods suffered relatively less from the Covid-19 crisis than the trade in non-agricultural goods, but at the same time growth was also less in 2021. Due to the need for food products, the agricultural sector is less sensitive to economic cycles and other crises. During the pandemic, agricultural trade with EU countries grew faster than trade with non-EU countries. Fruit exports have remained intact during the pandemic. The pandemic year 2020 was more difficult for exporters of ornamental horticulture products, meat, dairy products and eggs, and vegetables. Nearly 29% of agribusiness companies received government pandemic support, which was slightly less than average during the crisis. Of all agribusiness companies in international trade, 45% have received pandemic support from the government. That is slightly higher than the average for all trading companies (43%). More wholesalers of agricultural goods, food retailers and aquaculture farmers have applied for government support than average. See also Chapter 7
Trade policy in agriculture
The international trade in agricultural products and food products has grown enormously over the past 20 to 25 years, which was partly due to the reduction of import barriers and the harmonisation of trade rules within the framework of the WTO. Nevertheless, Dutch exporters of agricultural products to countries outside the EU are still confronted with relatively high import tariffs (18% on average). Exporters are also affected by non-tariff measures. In agriculture, this primarily concerns sanitary and phytosanitary measures (specifically aimed at protecting humans, animals and plants against diseases, pests or contaminants).
Besides the WTO trade frameworks, the UN Guiding Principles on Business and Human Rights (UN, 2011) are also in force. In 2018, the OECD presented a guideline for due diligence. This essentially means that companies are obligated to prevent or account for any negative societal and environmental consequences of their business activities. The European Commission is expected to publish a directive on Sustainable Corporate Governance in March 2022. Based on this directive, companies in the EU would be required to apply due diligence in their supply chains. This concerns societal themes (such as child labour, poor working conditions and slavery) as well as environmental themes (such as climate and biodiversity). See also Chapter 8
Import to destination
Approximately 70% of all agricultural imports are eventually re-exported. Of all re-exports, 43% are re-exported directly and 27% are re-exported indirectly (after processing in the Netherlands). This means that 30% of agricultural imports remain in the Netherlands. Of these remaining imports, 17 percentage points are intended for direct consumption and 13 percentage points are consumed after processing in the Netherlands. In the past five years, re-exports have increased slightly: from 68.5% in 2015 to 70.0% in 2020. See also Chapter 9
Trade in organic products
There is a growing need to monitor not only trade in products, but also the properties of the products themselves. This concerns the characteristics of both the product and the production process. The TRACES system is one of the few publicly available sources that links product characteristics to the CN (combined nomenclature) trade code. This provides insight into the trade in organic products. In 2020, about 181 million tonnes of agricultural goods were imported into the EU. Of this total, 2.8 million tonnes (1.5%) fell into the category of organic products. The most-imported organic product in the EU-27 countries is the banana, which was responsible for almost one-fourth of the total volume in 2020. The banana is followed by pressed cakes of animal feed, soybeans and coffee. The Netherlands is the largest importer of organic agricultural goods from countries outside the EU-27. See also Chapter 10
Trade and international prosperity
About 70% of global trade currently consists of international value chains, in which products pass through a number of countries before a final product is produced. The Netherlands also plays an important role in global value chains, for example with its imports and re-exports of tropical products such as cocoa, palm oil, coffee and soy. Recently, global value chains have come under increasing scrutiny. For example, there is growing concern that trade liberalisation is leading to greater inequality in low and middle-income countries. But there also appear to be opportunities: global value chains and the associated dependencies between countries could also play a major role in alleviating inequality. Besides mandatory legislation and regulations, other initiatives, such as various sustainability labels, also tackle problems in the chain. However, such a label on a product does not always guarantee that the sustainability goals are actually being achieved. Although positive effects of certification are known, for example farmers&39; incomes and working conditions have improved in some cases, these effects do not occur everywhere and may not be predominantly positive. See also Chapter 11
You can find the repport here.
|
Select a sector
|
|
|
|
|
|
|
|
|
|
|
|
|
|
|
|
|
|
|
|
|
|
|
|
|
All about
|
-
No data for this filter criteria
|
|
No data for this filter criteria
|
|
No data for this filter criteria
|
|
No data for this filter criteria
|
|
|
| More information |
 Indicator explanation Indicator explanation |
| Theme description |
| Policy information |
Archive
|
|
Top of page
 | Loading… |
|
|